IMPORTANT: Those features are NOT available in INTERACT Light.
Available Commands
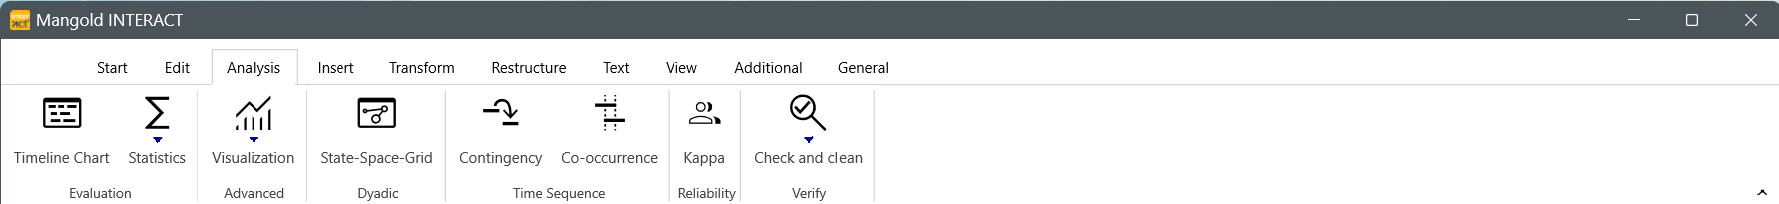
Evaluation |
|
 |
Timeline Chart - Opens the Timeline Chart, displaying the selected data chronologically, with the ability to zoom-in on a specific time frame. |
 |
Statistics - Various descriptive statistics |
|
Statistics per Code (tabels) - Full descriptive statistics on separate tabs per value type, like Duration, Frequency, Latencies, % over time, and many more, for all selected Codes & Classes. (Previous: Full statistics) |
|
Statistics per Code (report) - Full descriptive statistics as a report offering all value types in one table per DataSet, offering values like Duration, Frequency, Latencies, % over time, and many more, for all selected Codes & Classes. (previous: Statistics on DataSets) |
|
Statistics on all intervals of a given Code - Descriptive Statistics for Event-based intervals for a selected Code. |
|
Statistics per time interval - Descriptive Statistics per given interval for all Codes. |
|
Order of Code appearance - Report that shows the first occurrence of each Code, ordered by appearance per Set or per Class. |
|
Class Report - Report that lists the frequencies and Duration of all Codes in all Classes. Additionally the percentages of usage are available. All values are accumulated over all selected DataSets. |
|
Statistics on Codes aggregated per Class - Full descriptive statistics on separate tabs per value type, in which the values of all Codes are accumulated per Class |
|
Statistics on Metadata - Provides summaries of all descriptive value types for all Codes per metadata value, across DataSets |
Advanced |
|
|
Visualization |
|
Box Plot - Generates a Box plot diagram for all selected Codes and DataSets for any of the available descriptive statistics. |
|
Pie charts - Select a single Class and the pie chart will show you in percentages per occurrence or duration of those Codes within that Class, accumulated over all selected DataSets. |
|
Sankey / Chord diagram for sequential analysis - Visualization of immediate sequences (preceding and succeeding) among the selected Codes and DataSets. |
|
Word Cloud - Typical word cloud visualization for all text entered in into the transcription field of all Events. |
|
State-Space-Grid - Interaction visualization. Shows all overlaps for the two selected Classes over time. |
|
Timeline chart - Chronological visualization of all selected Codes on a timeline. |
Dyadic |
|
|
State-Space-Grid - Displays co-occurrences of all Codes from two different Classes. Requires mutually exclusive Codes per Class. Method for analyzing synchronized Event sequences, based on dynamic systems (DS) principles developed by Tom Hollenstein. |
Time Sequence |
|
|
Contingency - Analyze how often behavior A is followed by behavior B within a predefined interval and automatically create new events for those occurrences. |
|
Co-occurrence Filter - Find behavior that overlaps in time and create new Events for the instances found. This filter looks for occasions where all selected Codes occur simultaneously using AND logic. |
Reliability |
|
|
Kappa - Use the Cohen's Kappa routine to compare the content of two INTERACT documents. |
Verify |
|
|
Check and Clean - Offers commands for verifying data integrity. |