If you want to compare performance between subjects per experiment, but the start point for these experiments are different per subject INTERACT offers multiple routines to quickly align all sessions.
Move a Sets to zero
The easiest way to compare multiple sessions from the start is by virtually moving all DataSet start times to 00:00:00:00. this routine will leave the collected time information untouched, but the difference is noticeable instantly in the Timeline Chart and all related descriptive statistics.
Shifting the start time of all DataSets to 00:00:00:00 is the quickest way to sync all DataSets.
Example: If your sessions are stored in the same video file, the first session starts at 00:00:00:00 and the next session starts after the first session ended, let's say at 00:30:00:00. In the Timeline Chart, those DataSets appear on a very stretched time scale.
|
Start of the first session |
|
Start of the second session |
This makes it hard to compare the first 2 minutes of each session.
The fastest way to synchronize the start time of multiple DataSets, is to virtually set the start time of all DataSets to 00:00:00:00. INTERACT offers a command to perform that operation automatically. This command does not regard any specific Events:
▪Click Transform - DataSets - Time Shifts ![]() > Shift to Zero .
> Shift to Zero .
INTERACT enters a DataSetOffset command into the transcription area of each DataSet, virtually setting the start time of each DataSet to zero, like this:
•In DataSet 1: DataSetOffset100ns 238800000> 0 (reflects 00:00:23:22 = 0)
•In DataSet 2: DataSetOffset100ns 48400000 > 0 (reflects 00:00:04:21 = 0)
Rebuild the Timeline Chart to see the results:
▪Click Analysis - Evaluation - Timeline Chart ![]() , to recreate your Timeline Chart.
, to recreate your Timeline Chart.
▪Click Align on Zero ![]() , to hide all Events that now lay virtually before zero. This is important to get the correct statistics.
, to hide all Events that now lay virtually before zero. This is important to get the correct statistics.
IMPORTANT: Only if you click the Align on Zero ![]() icon (to hide all Events logged before the new, shifted start time) those preliminary Events are no longer present in the statistics!
icon (to hide all Events logged before the new, shifted start time) those preliminary Events are no longer present in the statistics!
Because the Code 'Call dolphins' was the first Code coded in DataSet 2, this Code now appears directly at the start, whereas for DataSet 1 other Codes where coded first.
| TIP: | To get statistics on a fixed time frame for all DataSets, take a look at the topic Time-based Interval Selection. |
Note: This command is of no use if you want to synchronize certain Codes, but is very useful to compare DataSets that have been logged with totally different (start) times.
Synchronize on a Specific Code
This command allows you to compare the reactions, in different session, starting from a specific command.
Therapy session: Presume you have logged two sessions of a child, during its dolphin therapy, and you have collected this data in two different DataSets.
Now you want to compare the behavior of the child from the moment on that the command "call dolphins" was given.
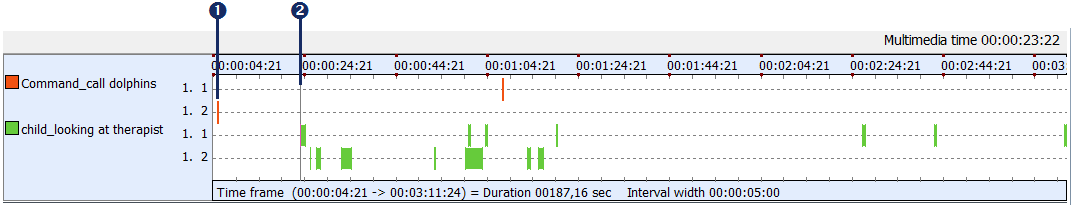
If you create a Timeline Chart of those two DataSets, without adjusting anything, the results are hard to compare. Simply because it is rather unlikely that this command "call dolphins" is given at exactly the same time in both sessions:
|
Command 'call dolphins' in DataSet 2 |
|
Command 'call dolphins' in DataSet 1 |
To synchronize this type of data, based on a specific Code Event, this Code needs to be available in each DataSet.
▪Open the data file in which you want to synchronize the DataSets (Merge multiple data files to get an overall comparison)
▪In the toolbar, select Transform - DataSets -Time Shifts ![]() > Sync to Code .
> Sync to Code .
▪Select the Class and Code you want to use for synchronization, from the upcoming dialog.
A second dialog appears, asking for point the time to which Events are synchronized.
▪We entered 00:00:10:00 (to still see the Events that occurred in the last 10 seconds before the selected Code was first logged).
▪Confirm with OK.
INTERACT now enters the appropriate DataSetOffset command, for each DataSet, into the the Transcription field of each DataSet. This synchronizes all data at the first occurrence of the selected Code.
▪Click Analysis - Evaluation - Timeline Chart ![]() , to recreate your Timeline Chart.
, to recreate your Timeline Chart.
▪Click Align on Zero ![]() , to hide all Events that now lay virtually before zero. This is important to get the correct statistics.
, to hide all Events that now lay virtually before zero. This is important to get the correct statistics.
IMPORTANT: Only if you click the Align on Zero ![]() icon (to hide all Events logged before the new, shifted start time) those preliminary Events are no longer present in the statistics!
icon (to hide all Events logged before the new, shifted start time) those preliminary Events are no longer present in the statistics!
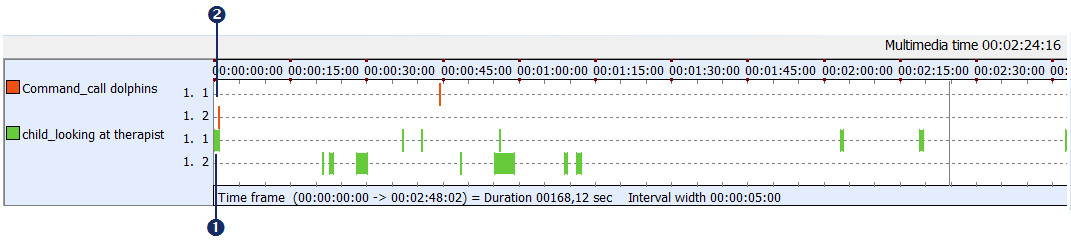
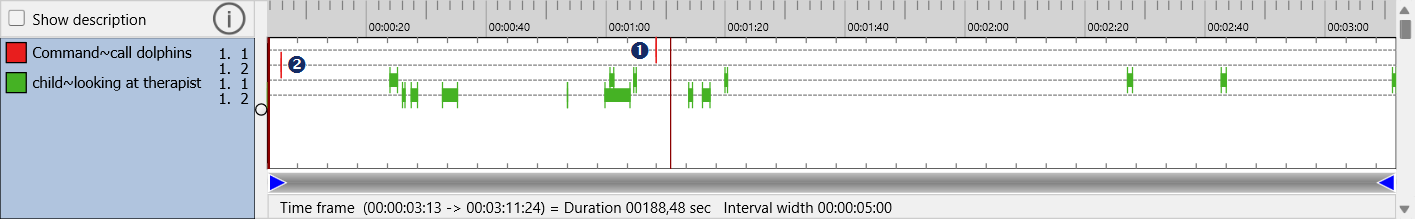
Because we set the synchronization point to 00:00:10:00, our example diagram now looks like this:
IMPORTANT: Synchronizing the Events for the selected Code in all DataSets to 00:00:00:00, ignores all Events logged before the synchronization Code.
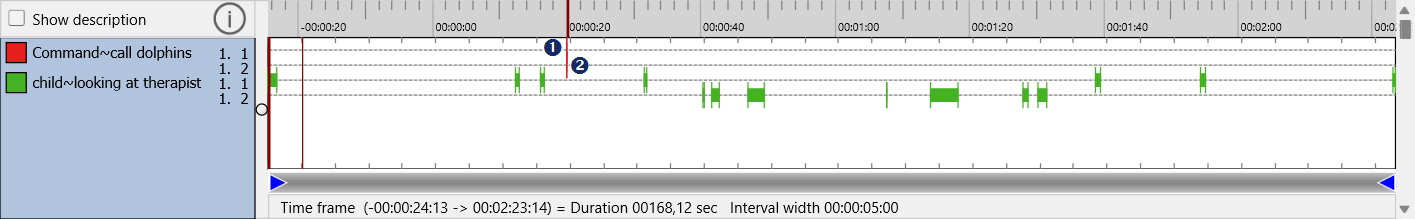
To include Codes that are coded before this synchronization Code (e.g. the last 10 seconds before this Code was coded), enter the appropriate time value into the second dialog (e.g. 00:00:10:00 to include those last 10 seconds before the first occurrence of the selected Code) This results in an offset string like this: DataSetOffset100ns 684000000 > 100000000).
▪For details on all virtual time shifts, read the section Move DataSets Virtually in Time.
Compare Statistics for Identical Intervals
Even if your observations are now aligned, the Sets may differ in length or you might only be interested in the first 30 seconds or so. To get comparable results for all Sets, you'll need to specify a time frame during the analysis.
The method is based on the fact that the descriptive Statistics only reflect the currently visible Codes in the Timeline Chart.
This functionality allows you to get the statistics on e.g. the first 30 seconds of your session!
IMPORTANT: If you store multiple sessions within the same file, using separate DataSets for each session, those DataSets might not start at the same time.
This makes comparing the first so many seconds difficult.
To solve that, you can synchronize all DataSets in different ways.
Take a look at the various possibilities to virtually shift DataSets in time, as described in Move DataSets virtually in time, so you can compare them on a time line.
Set Interval
The required time frame can be set like this:
▪Click Analysis - Evaluation - Timeline Chart ![]() to create a Timeline Chart.
to create a Timeline Chart.
▪Click the Select interval ![]() icon, in the Timeline Chart toolbar.
icon, in the Timeline Chart toolbar.
The upcoming 'Select time window' dialog enables you to define a precise interval or you can enter a specific start and end time manually:
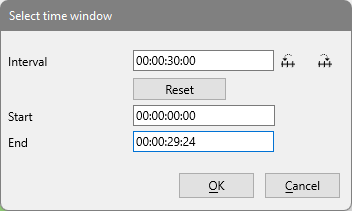
▪Enter the required interval into the Interval text field.
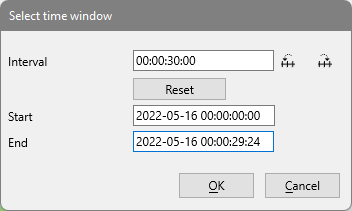
▪If you logged your Events including a date, enter that start date into the field Start.
The two buttons, on the right of the Interval field, help you enter the exact start and end time of the Next interval ![]() or Previous interval
or Previous interval ![]() - based on the interval length entered in the Interval field.
- based on the interval length entered in the Interval field.
IMPORTANT: If you logged your Events including a date, enter your start date into the Start text box, in front of the time value before you click the Next interval ![]() button!
button!
In this example an interval of 30 seconds has been defined.
▪One click on the Next interval ![]() button enters the correct start and end time of this interval.
button enters the correct start and end time of this interval.
▪Click OK to confirm your settings.
The Timeline Chart now shows only data of those first 30 seconds.
▪Use the Next interval ![]() and Previous interval
and Previous interval ![]() buttons within the Timeline Chart window to view each interval at a time.
buttons within the Timeline Chart window to view each interval at a time.
IMPORTANT: The statistics, exports and analysis routines available within the Timeline Chart, always reflect the data currently visible in the Timeline Chart.
If e.g. you are ‘zoomed-in' on just a part of your data, only this part is taken into account in the statistics results.
▪For further information about the limitation possibilities within the Timeline Chart, read the section Filters & Views.