The INTERACT Time Line Chart, is a very powerful tool during analysis of your coded data!
Our Time Line Chart offers:
oChronological visualization of your coded data
oA wide range of statistical values, split per DataSet
oData filtering and export routines.
oAnalysis routines like p.a.t.t.e.r.n. and Sequential analysis
Create a Time Line Chart
•To analyze your data, click Analysis - DataSet - Main Statistics ![]() .
.
•Select the Codes, Classes and DataSets you want to analyze in the upcoming dialogs, to get to the Time Line Chart:
(A detailed description of this procedure is available in Data Selection - Codes & Classes.)
The Time Line Chart offers instant statistics and export routines, all based on the data that is currently visible!
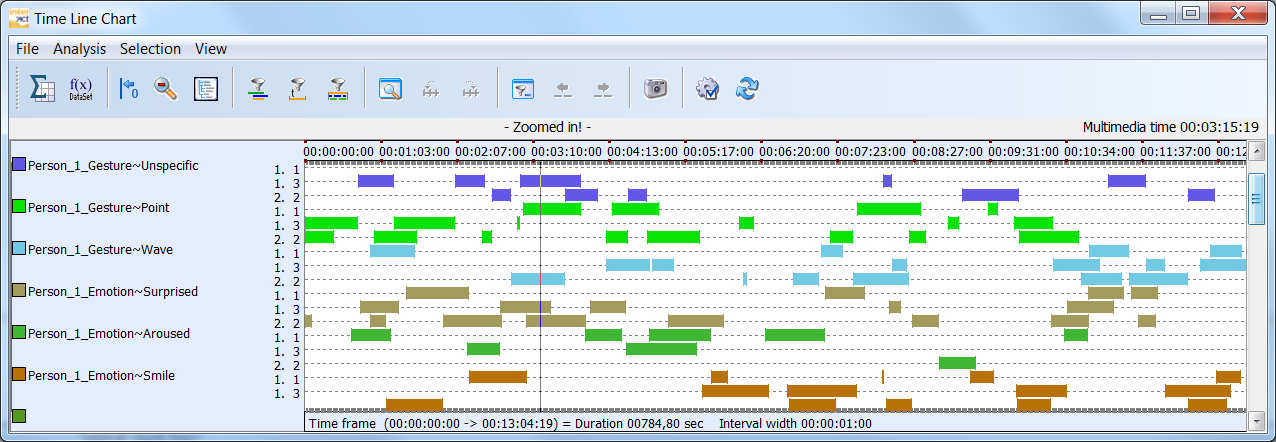
All coded Codes are always displayed chronologically. Moving your mouse over the Codes provides the video time information in the upper right corner.
By cleverly using and combing the possibilities of the various filters as well as the zoom functionalities, you gain access to various statistical reports and export possibilities.
Available icons
|
Full statistics - Opens the Full statistics result dialog, showing you figure based statics on your data. Read the section Full statistics for details. |
|
DataSet based statistics - Opens the statistic results dialog with an overview of various statistics per DataSet. Read DataSet statistics for details. |
|
Align on zero - If you make use of the Sync On Code routine, to virtually align you data on a specific Code, this command is vital to get the right statistics. One click hides all Events that virtually occur before zero. |
|
Zoom out - Only available if not all selected data is visible. Returns the view of your data to its original size. Read the section Zoom in on your data to learn how to use this powerful feature. |
|
Open Code Archive - Opens the Code Archive editor, in which you can re-arrange the order of your Codes and Classes, change abbreviations and colors. |
|
Co-occurrence filter - This functionality offers you the possibility to search for co-occurring Codes. Read the section Co-occurrence filter for details. |
|
Duration filter - This filter allows you to virtually remove codes from the time line chart based on their duration. Read Duration filter for details. |
|
Trim on Code filter - This filter allows you to identify all codes that where coded during the same time intervals whenever a specific Code was coded. Read the topic Trim on code filter for details. |
|
Time based interval - Enables you pre-define an exact time window (or interval) to be visualized in the Time Line Chart. Very useful if you want the statistics on only part of your data! Read Time based Interval Selection for details. |
|
Previous interval - Only available if an interval has been defined in the Time window dialog. |
|
Next interval - Only available if an interval has been defined in the Time window dialog. This button enables you to 'jump' through your data in identical steps, all with the exact same duration. |
|
Code based interval - This is a combination of the Trim on Code filter and the Time based interval functionality. It allows you to use a specific code from a specific DataSet to create a dynamic time interval, in order to analyze you Codes per occurrence of the selected code. Read Code based Interval Selection for details. |
|
Previous interval - Only active if a code has been selected in for the Code based interval functionality. |
|
Next interval - Only active if a code has been selected in for the Code based interval functionality; it allows you to jump to the next occurrence of the selected code. |
|
Snap shot chart - Copies the content of the TLC window, enabling to simply copy & paste the chart into another application. |
|
Options - Opens the TLC Options dialog, offering you a wide range of visualization and statistics options. Read Time Line Chart options for details. |
|
Refresh - Click this icon to make a redraw of the chart. This is sometime necessary after altering some of the options. |
Additionally, the Analysis menu offers some very useful and advanced analysis and export routines:
oExport data per Code...
oPattern analysis (See the p.a.t.t.e.r.n. helpfile)
oPattern graph
oSequential analysis
A complete description of the Time Line Chart functionality can be found in the sections DataSet based Statistics and Time Line Chart Details.
IMPORTANT: All time line based statistics are based on the data currently visible in the Time Line Chart window, only!